

Under President Donald Trump’s newly signed tax law, “Those making less than $50,000 receive the largest (tax) cuts.”


Our only agenda is to publish the truth so you can be an informed participant in democracy.
We need your help.
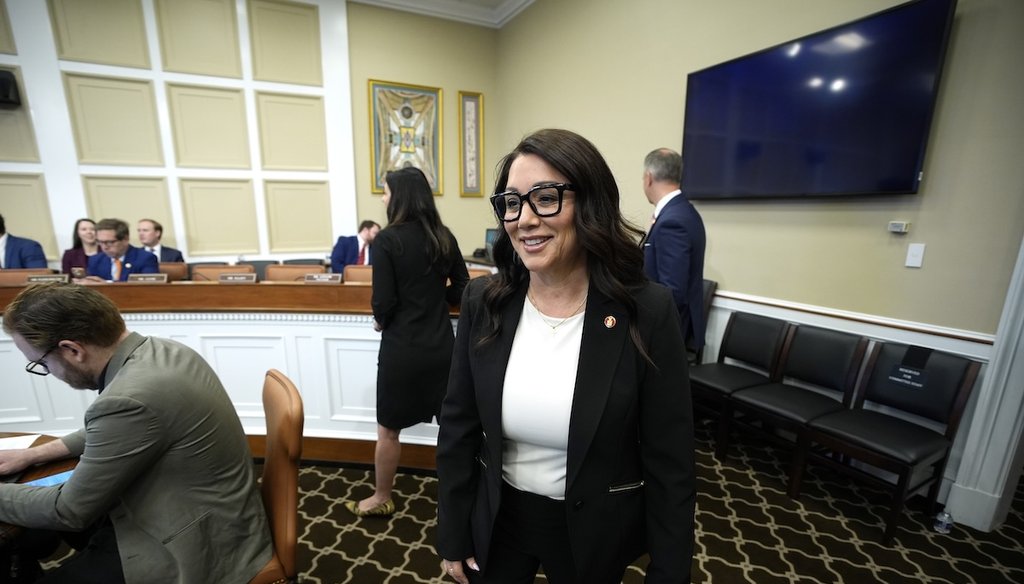
Secretary of Labor Lori Chavez-DeRemer arrives to testify before a House Appropriations subcommittee on May 15, 2025. (AP)

Labor Secretary Lori Chavez-DeRemer cited data from a credible source, but it is cherry-picked and reflects only the law’s new policies.
The data ignores some of the law’s policy extensions that benefit the wealthy and omits that many of the benefits for lower- and middle-income families will sunset after 2028.
The data exaggerates the tax gains for households with modest incomes by focusing on the change in their tax liability, rather than their after-tax income — the measure analysts more commonly use.
Now that President Donald Trump has signed his signature tax and spending bill, his administration is working to sell it to the American public.
Labor Secretary Lori Chavez-DeRemer shared a chart July 17 on X showing lower- and middle-income Americans gaining the most from the new law’s tax provisions.
"The One Big, Beautiful Bill’s tax cuts overwhelmingly benefit America’s Workers," she wrote. "Those making less than $50,000 receive the largest cuts — allowing hardworking families to keep more of their paychecks."
However, this characterization relies on cherry-picked data and clashes with the analyses by independent experts.
It encapsulates only new changes in the just-signed bill and ignores the continuation of tax cuts that benefit wealthier taxpayers. It exaggerates the tax gains for households with modest incomes by focusing on the change in their tax liability, rather than their after-tax income. And it chooses a year when tax breaks for tips, overtime and Americans 65 and older are still in force, rather than after they expire.
When we asked the Labor Department for its source, a department spokesperson pointed us to an analysis by the Joint Committee on Taxation, a bipartisan committee in Congress.
The committee found that in 2027, under the new law:
Tax liability would drop by 16.4% for households earning less than $15,000;
Tax liability would drop by 27.1% for households earning between $15,000 and $30,000;
Tax liability would drop by 9.5% for households earning between $30,000 and $40,000;
Tax liability would drop by 7.2% for households between $40,000 and $50,000.
For every income grouping higher than $50,000, the decrease would be smaller than 6%.
But Chavez-DeRemer misrepresented the data, providing a skewed view of the bill’s impacts.
Understanding the data Chavez-DeRemer cited requires several important bits of context.
Chavez-DeRemer’s chart doesn’t account for the law’s 2017 tax cuts extension.
The tax law Trump signed in 2017 was set to end in 2025, at which point tax rates would have reverted to their higher, pre-2017 levels. (Trump prevented this by signing the law this month.)
The chart she used accounts only for the 2025 law’s new changes, not its broad renewal of the 2017 tax cuts.
This is important because many of the new tax changes in the 2025 law — such as tax breaks for tips, overtime and older Americans — benefit lower- and middle-income taxpayers, partly because tipped and overtime workers tend to be less affluent, and partly because these provisions include income caps blocking wealthier taxpayers from benefiting.
The result of excluding those tax extensions exaggerates the share of the tax benefits going to Americans of more modest means.
The chart data looks at changes in taxes paid, rather than the income remaining after taxation.
Another aspect of the data in Chavez-DeRemer’s chart further exaggerates this tendency of spotlighting the benefits to Americans of more modest incomes.
The chart takes the bill’s tax savings by income level and divides that by that income level’s previous tax payment. Doing that produces a percentage change — in this case, a decline for all income groups — in taxes paid.


But lower- and middle-income households pay less in taxes, in raw dollars, than higher-income households do. This produces a relatively small denominator — that is, the amount of taxes paid before the law’s changes — and exaggerates the scale of any tax gains from the 2025 law.
To avoid this problem, independent tax analysts focus on a different statistic: the percentage change in after-tax income. Here, the denominator isn’t taxes paid, but total income.
Two think tanks — the Urban Institute-Brookings Institution Tax Policy Center, which is ideologically middle of the road, and the Tax Foundation, which is center-right — have long used the latter method, and both of their analyses sharply contrast with the data Chavez-DeRemer cited. Their analyses show lower- and middle-income households benefiting from the tax bills, but those in the top half of the income scale benefiting even more.
The two groups’ methodologies don’t produce the same percentage increases in after-tax income; a big reason is that the Tax Policy Center’s income definition for the denominator is broader than the Tax Foundation’s. But the overall trends are similar for both think tanks, and they both differ from the conclusions in Chavez-DeRemer’s post.
Chavez-DeRemer cherry-picks data from before temporary tax breaks expire.
The data in Chavez-DeRemer’s post is a projection for 2027. That’s a year when the tax breaks for tips, overtime and older Americans will still be in force. But the Joint Committee on Taxation’s analyses for the years after those breaks are set to expire offer a different impression.
By 2031, after those breaks expire, the Joint Committee on Taxation’s calculation shows that households up to $15,000 would see a tax increase of 0.3% — not a decline. And while the next-lowest income groups would see tax savings, the amounts would be much smaller than the 2027 tax reductions in Chavez-DeRemer’s chart.
In 2031, the committee projected that:
Households in the $15,000 to $30,000 range would see a decrease of 5.1% (not 27.1%);
Households in the $30,000 to $40,000 range would see a decrease of 3.5% (not 9.5%)
Households in the $40,000 to $50,000 range would see a decrease of 2.6% (not 7.2%).
Chavez-DeRemer said that under Trump’s newly signed law, "Those making less than $50,000 receive the largest (tax) cuts."
Chavez-DeRemer cherry-picked data that shows the law in the most favorable light while ignoring its larger scope.
The chart data focuses on the law’s new policies rather than its existing policy extensions that benefit the wealthy. In addition, it compares taxes paid, which exaggerates the scale of the changes for households with modest incomes; a comparison of after-tax income changes shows bigger gains for upper-income households. Finally, Chavez-DeRemer’s post ignores that many of the benefits for lower- and middle-income families are poised to sunset after 2028.
The statement is based on real data from a credible source, but it ignores other evidence from that source and others that give a different impression, so we rate it Mostly False.
Lori Chavez-DeRemer, X post, July 17, 2025
Joint Committee on Taxation, analysis, June 30, 2025
Urban Institute-Brookings Institution Tax Policy Center, "T25-0231 – Reconciliation Bill, One Big Beautiful Bill Act (OBBBA), As Passed by the House and Senate, Distribution by ECI Percentile, 2026," accessed July 18, 2025
Tax Foundation, "‘One Big Beautiful Bill Act’ Tax Policies: Details and Analysis," July 4, 2025
Email interview with Garrett Watson, director of policy analysis at the Tax Foundation, July 17, 2025
Interview with Joseph Rosenberg, senior fellow at the Urban Institute-Brookings Institution Tax Policy Center, July 17, 2025


In a world of wild talk and fake news, help us stand up for the facts.


